
nGrinder测试举例
下面给大家举一个完整的例子,演示怎么使用nGrinder工具进行注册接口的性能测试。
启动Agent和Monitor目前我们工具是部署在内网的,测试的也是内网站点,web服务器地址为:192.168.1.13,nGrinder地址为:192.168.1.51,agent地址为:192.168.1.48,均为Linux服务器。 agent和monitor的安装方法这里就不复述了
- 启动agent
#./run_agent_bg.sh启动后在代理列表中可以看到机器ip即成功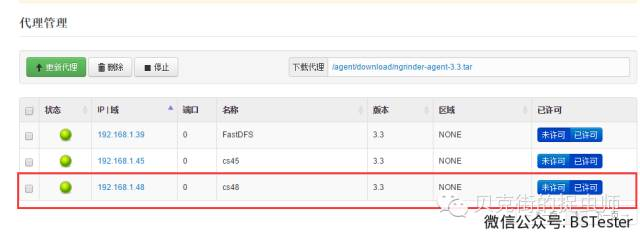
+ 启动monitor\# ./run\_monitor\_bg.sh
- 收集自定义数据nGrinder 支持自定义监控目标服务器的数据。如果你想要通过 nGrinder 的monitor来监控目标服务器默认不提供的数据或状态,可以使用任何你喜欢收集数据的工具(最好将工具设置跟nGrinder 测试的采样间隔一样)。并且数据应保存在下面路径文件中:
${ngrinder_agent_home}/monitor/custom.data此文件的内容由几个","将监测值分离,像下面这行:315630613,1123285602,1106612131然后,您需要确保在测试运行期间更新这个文件。如果你有一个 shell 脚本命名为"update.sh"用来更新 custom.data 文件,你可以用下面命令来定时运行它watch -n 1 update.shnGrinder 监视器定期读取 custom.data 文件,如果存在,并且将数据发送到 nGrinder 控制器。 测试完成后,您可以看到这些目标监测页面的详细测试报告中数据的图表: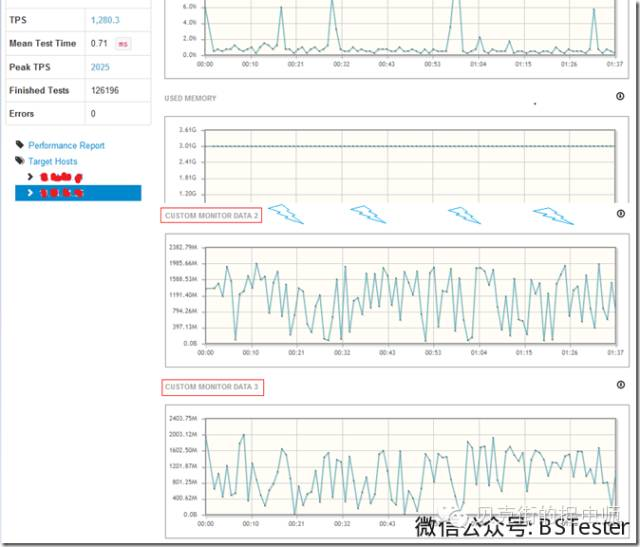
找到有图表命名为“CUSTOM MONITOR DATA 1”, “CUSTOM MONITOR DATA 2” .., 一直到“CUSTOM MONITOR DATA 5”。监视器可以收集最多 5 自定义数据。我们在做接口测试时,如果想监控php-fpm的数量变化情况,那么我们就可以编写一个customMonitor.sh的脚本,内容如下:netstat -tplnao | grep php | grep ESTABLISHED | wc -l > /root/.ngrinder_agent/monitor/custom.data启动定时监控(每隔1秒更新一次数据):watch -n 1 sh customMonitor.sh & - 录制脚本以我们官网为例:启动录制插件

在右边的浏览器中正常操作注册的过程
因为我们只测试接口,所以把不需要的请求删除掉,在不需要的请求上右键选择删除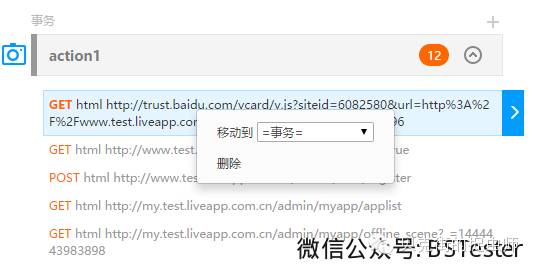
仅保留注册接口的请求链接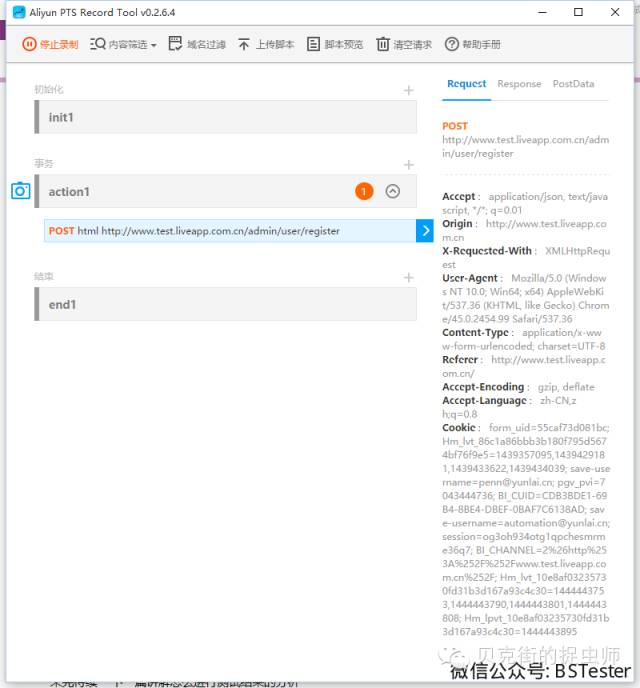
预览下脚本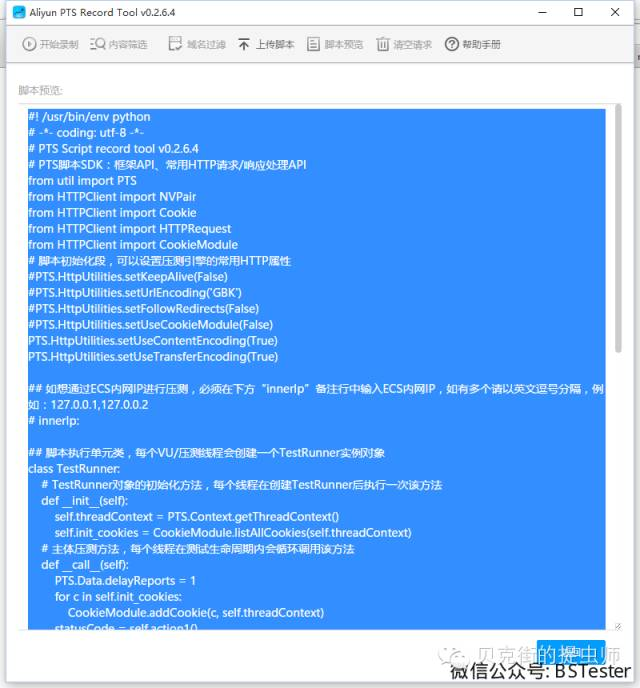
至此,脚本就算录制完了。 修改脚本录制的脚本,我们并不是都需要,复制出下面这段代码
\## action1
def action1\(self\):
statusCode = \[0L, 0L, 0L, 0L\]

headers = \[ NVPair\('Accept', '\*/\*'\), NVPair\('Origin', 'http://www.test.liveapp.com.cn'\), NVPair\('X-Requested-With', 'XMLHttpRequest'\), NVPair\('Content-Type', 'application/x-www-form-urlencoded; charset=UTF-8'\), NVPair\('Referer', 'http://www.test.liveapp.com.cn/\?showLoginBox=true'\), NVPair\('Accept-Encoding', 'gzip, deflate'\), NVPair\('Accept-Language', 'zh-CN,zh;q=0.8'\), NVPair\('User-Agent', 'PTS-HTTP-CLIENT'\), \]
result = HTTPRequest\(\).POST\('http://www.test.liveapp.com.cn/admin/user/register', '''email=autotest\%40test.test\&link=\&password=123456\&refer=\&telephone=\&type=\&verify=\&vip=''', headers\)
PTS.Framework.addHttpCode\(result.getStatusCode\(\), statusCode\)

## statusCode\[0\]代表http code \< 300 个数,    statusCode\[1\] 代表 300\<=http code\<400 个数
# statusCode\[2\]代表400\<=http code\<500个数,  statusCode\[3\] 代表 http code >=500个数
# 如果http code 300 到 400 之间是正常的
# 那么判断事务失败,请将statusCode\[1:3\] 改为   statusCode\[2:3\] 即可
if\(sum\(statusCode\[1:3\]\) > 0\):
    PTS.Data.forCurrentTest.success = False
    PTS.Logger.error\(u'事务请求中http 返回状态大于300,请检查请求是否正确\!'\)

return statusCode
在nGrinder的脚本管理中新建脚本
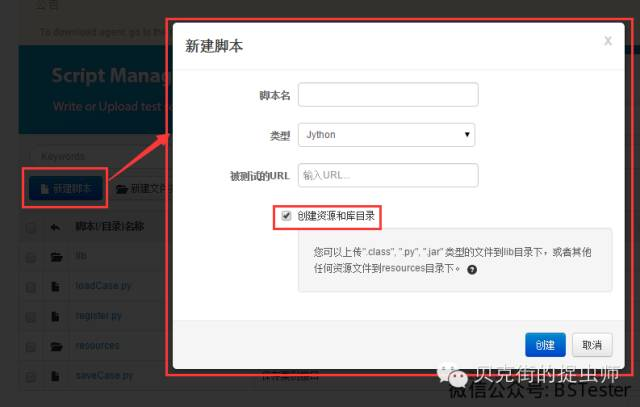
记得勾选上“创建资源和库目录”,这项并不是每次都需要,请视情况而定,因为我们需要引入自定义的模块,之前已经配置好的可以不用再创建。填写脚本名register,选择脚本类型为Jython后,就可以点击创建按钮创建了。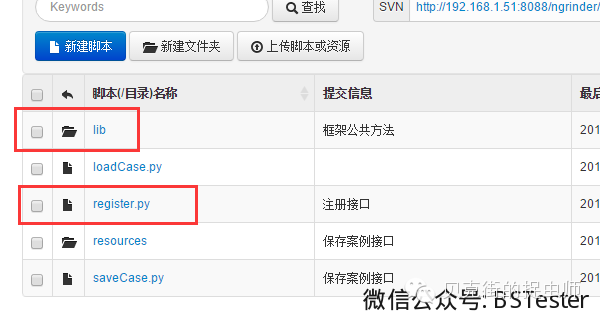
在lib目录中我们需要上传自定义模块的脚本PTS.py,内容如上篇所述,大家可根据情况修改和补充。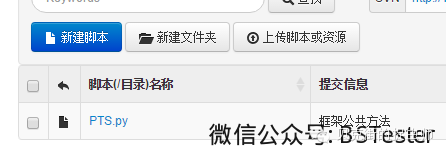
打开编辑register.py脚本文件
新建一个函数,这里命名为register,函数内容即为上文中复制的那段代码。因为脚本跟阿里云PTS的结构也不完全相同,阿里云PTS所有的执行过程操作函数是在TestRunner类里面的,而nGrinder所有执行过程操作函数在TestRunner类外面,nGrinder默认生成的脚本也没有对cookie的处理,所以需要对脚本做一些修改如下(具体修改请看脚本注释):\# -\*- coding:utf-8 -\*- # A simple example using the HTTP plugin that shows the retrieval of a # single page via HTTP. # # This script is automatically generated by ngrinder. # # \@author admin from net.grinder.script.Grinder import grinder from net.grinder.script import Test from net.grinder.plugin.http import HTTPRequest from net.grinder.plugin.http import HTTPPluginControl from HTTPClient import CookieModule #引入cookie模块 from HTTPClient import NVPair import PTS #引入自定义模块 import random control = HTTPPluginControl.getConnectionDefaults\(\) # if you don't want that HTTPRequest follows the redirection, please modify the following option 0. #control.followRedirects = 1 # if you want to increase the timeout, please modify the following option. control.timeout = 600000 #设置网络超时时间,单位毫秒 control.useContentEncoding = 1 #允许用户自定义文本编码格式 control.useTransferEncoding = 1 #允许用户自定义传输编码格式 #注册过程函数,大家可自行对比阿里云PTS录制的脚本差异 def register\(\): statusCode = \[0L,0L,0L,0L\] #自定义模块需要,统计http响应码个数 checkPointStatus = \[0L,0L\] #自定义模块需要,统计通过检查点的个数 #headers与阿里云PTS录制的保持一致 headers = \[ NVPair\('Accept', '\*/\*'\), NVPair\('Origin', 'http://www.test.liveapp.com.cn'\), NVPair\('X-Requested-With', 'XMLHttpRequest'\), NVPair\('Content-Type', 'application/x-www-form-urlencoded; charset=UTF-8'\), NVPair\('Referer', 'http://www.test.liveapp.com.cn/'\), NVPair\('Accept-Encoding', 'gzip, deflate'\), NVPair\('Accept-Language', 'zh-CN,zh;q=0.8'\), NVPair\('User-Agent', 'PTS-HTTP-CLIENT'\), \] #注册接口post的数据 postData = \[ NVPair\('email', ''.join\(random.sample\('abcdefghijklmnopqrstuvwxyz',6\)\) + '\@automation.test'\), NVPair\('link', ''\), NVPair\('password', '123456'\), NVPair\('refer', ''\), NVPair\('telephone', ''\), NVPair\('type', ''\), NVPair\('verify', ''\), NVPair\('vip', ''\) \] result = HTTPRequest\(\).POST\('http://www.test.liveapp.com.cn/admin/user/register', postData, headers\) #自定义文本检查点,检查返回值 if result.getText\(\).find\('"success":true'\) \!= -1: PTS.sumCheckPointStatus\(1,checkPointStatus\) else: PTS.sumCheckPointStatus\(0,checkPointStatus\) PTS.addHttpCode\(result.getStatusCode\(\),statusCode\) return statusCode,checkPointStatus #返回http响应码和检查点的统计数据 # Make any method call on request1 increase TPS Test\(1,'Register'\).record\(register\) #设置测试对象函数 class TestRunner: # initlialize a thread def \_\_init\_\_\(self\): grinder.statistics.delayReports=True #自动处理cookie self.threadContext = HTTPPluginControl.getThreadHTTPClientContext\(\) self.login\_cookies = CookieModule.listAllCookies\(self.threadContext\) # test method def \_\_call\_\_\(self\): sumStatusCode = \[0L,0L,0L,0L\] #因为每次执行测试cookie会被清空,所以这里需要每次重新设置cookie for c in self.login\_cookies: CookieModule.addCookie\(c, self.threadContext\) httpCode,checkPoint = register\(\) #执行注册操作 PTS.sumHttpCode\(httpCode,sumStatusCode\) #统计总的http响应码个数 #grinder.sleep\(3000\) # if you want to print out log.. Don't use print keyword. Instead, use following. #grinder.logger.info\(str\(sumStatusCode\)\) # statusCode\[0\]代表http code \< 300 个数, statusCode\[1\] 代表 300\<=http code\<400 个数 # statusCode\[2\]代表400\<=http code\<500个数, statusCode\[3\] 代表 http code >=500个数 # 如果http code 300 到 400 之间是正常的 # 那么判断事务失败,请将statusCode\[1:4\] 改为 statusCode\[2:4\] 即可 if sum\(sumStatusCode\[1:4\]\) > 0 : grinder.statistics.forLastTest.success = 0 grinder.logger.error\(u'事务请求中http 返回状态大于300,请检查请求是否正确\!'\) elif checkPoint\[1\] > 0 : grinder.statistics.forLastTest.success = 0 grinder.logger.error\(u'事务请求中有 \%s 个检查点没通过\!' \% checkPoint\[1\]\) else: grinder.statistics.forLastTest.success = 1- 调试脚本先自定义配置DNS解析到内网,请注意,配置服务器的host是没用的。
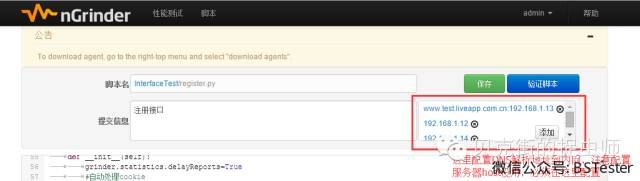
然后点击“验证脚本”按钮开始调试脚本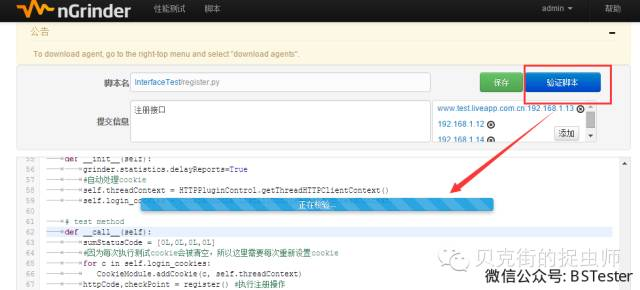
点击页面下面的“+”按钮可展开调试日志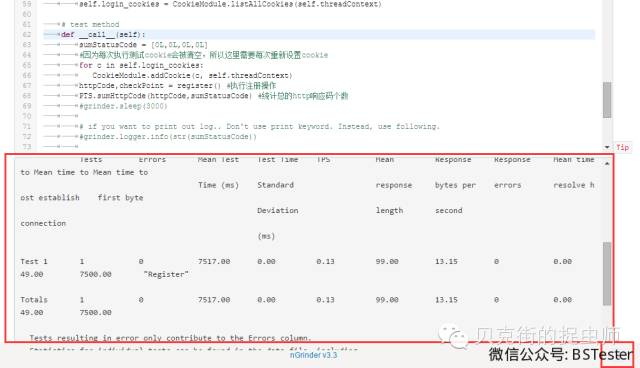
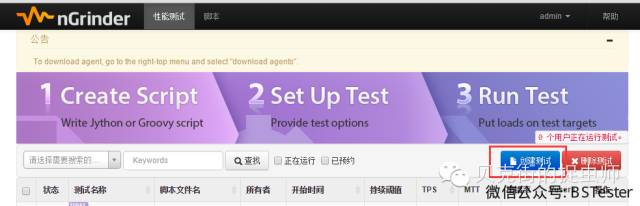
没提示报错即调试通过 - 配置测试在测试任务管理页面,新建一个测试任务
配置测试场景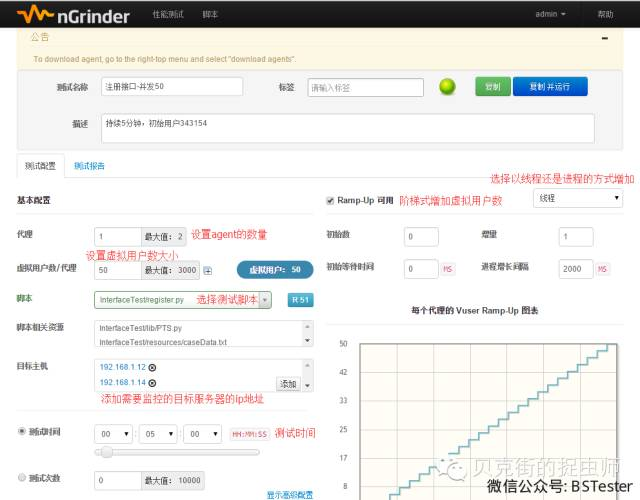
如图,可配置虚拟用户数的总大小,增加虚拟用户数的方式,测试脚本的版本,需要监控的目标服务器,测试时间等信息。 - 运行测试配置完后,选择右上方的“保存并运行”按钮,如果是已经运行过的选择“复制并运行”按钮
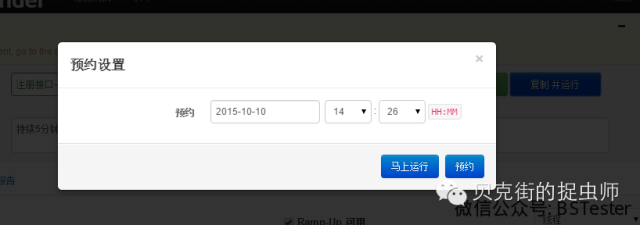
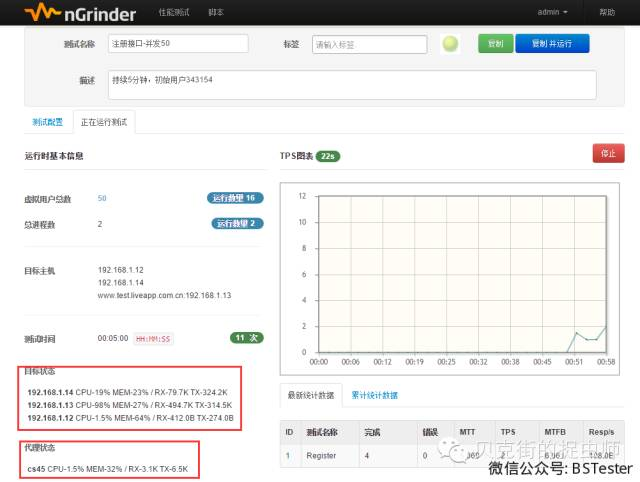
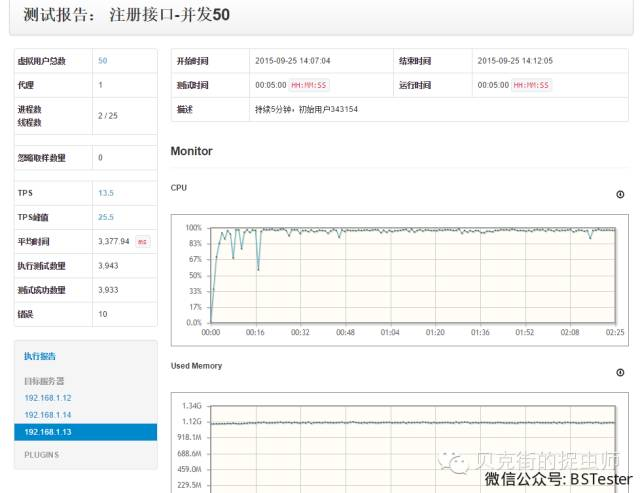
在弹出的窗口中,可以设置定时执行的时间,或者是立即执行。 - 查看结果启动测试任务后,会看到实时的测试状态,包括目标服务器的CPU/内存消耗的信息,代理服务器CPU/内存消耗的信息,实时的TPS变化等信息。
测试完成后,会列出概要的测试结果信息,包括平均响应时间,TPS,虚拟用户数,出错率等信息。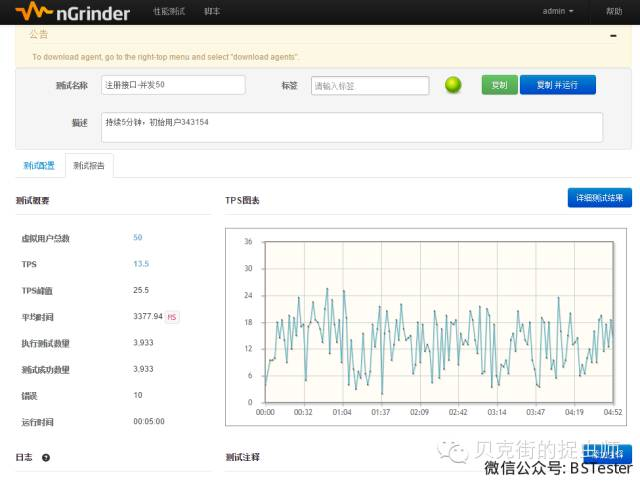
点击“详细测试结果”按钮,便可查看详细的测试报告及服务器资源消耗情况。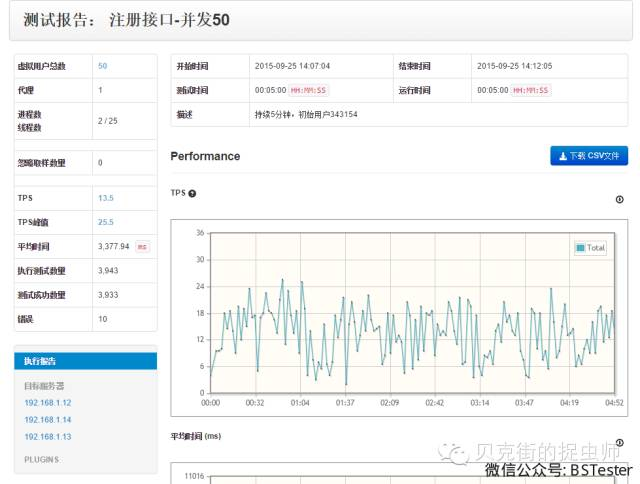
未完待续 下一篇讲解怎么进行测试结果的分析